Saturday, 20 November 2010

Lab Report - Mitosis in garlic root tips


Principles of Biology
19/10/2010
Student ID no :
MARK : 58

                                                               MITOSIS
IN ROOT TIPS


Aim
The purpose of this practical is to observe and identify under the light microscope the stages of mitosis division(interphase, prophase, metaphase, anaphase, telophase) by using meristemetic tissue from root tips.


Introduction
Mitosis is a cellular process that replicates chromosomes and produces two identical nuclei in preparation for cell division. Mitosis has five phases: interphase, prophase, metaphase, anaphase and telophase. University of Illinois has an example of plant cells undergoing mitosis shown in Fig1.
Two identical daughter cells are produced after the mitosis process has been completed, they are identical with the parent cell.
Fig1. Plant cells in different phases of Mitosis:

Interphase Prophase Metaphase Anaphase Telophase
Photo taken from : http://www.life.illinois.edu/ib/102/lectures/08reproduction.html


Interphase. The DNA duplicates during interphase to prepare for mitosis. Chromosomes are not clearly discerned in the nucleus.


Prophase. Chromatin in the nucleus begins to condense and becomes visible in the light microscope as chromosomes. The nuclear membrane dissolves. Microtubules attach at the kinetochores and the chromosomes begin moving.


Metaphase. Spindle fibers align the chromosomes along the middle of the cell nucleus. This line is referred to as the metaphase plate. This organization helps to ensure that in the next phase, when the chromosomes are separated, each new nucleus will receive one copy of each chromosome.


Anaphase. The paired chromosomes separate at the kinetochores and move to opposite sides of the cell. Motion results from a combination of kinetochore movement along the spindle microtubules and through the physical interaction of polar microtubules.


Telophase. New membranes form around the daughter nuclei while the chromosomes disperse.


Plant material:
The experiment was conducted using garlic cloves root tips.
Growth in an organism is controlled by regulating the cell cycle. In plants, the root tips continue to grow as they search for water and nutrients. These regions of growth (meristematic tissues) are good for studying the mitosis because at any given time, undergoing mitosis division can be observed in the root tips cells.
Chemical substances used in the experiment.
1M HCl. Clear imagines of the cell won`t be possible to obtain if cells are still held together by the middle lamella of calcium pectate. Under the microscope the imagine would show cells on top of each other like a thick layer making impossible to identify the structure of each individual cell. Hydrochloric acid is used in experiment to react with the calcium pectate contained in the middle lamella and break the bond between cells .By adding HCL to the material is also "killing" the components of the cell so it makes it easier to fixate the material on the microscope slide.
Toluidine stain in dropping bottle.
The use of toluidine is to stain nuclei of the cells. Toluidine blue is a cationic dye which binds to tissue and give a colour of purple-greenish blue when in contact with nucleic acids from nuclei.This solution does not stain the cytoplasm so the nuclei are very distinctive in the imagine.
Light Microscope.
Light microscope use visible light to illuminate the specimen and can magnify up to 1000 times the size of the material.


Apparatus and Procedure


Apparatus :
Watch glass
Hollow glass block
Pipette
1M HCL
Sheets of soft absorbent paper
Pair fine forceps
Microscope slides and coverslips
Toluidine stain in dropping bottles
Clove of garlic which have been stimulated to grow.

Microscope: Motic B3 Professional series as shown in the picture below (Fig. 2)
            Motic B series
            Serial no 30208745
            Equipment no MCOLL 06933


            Fig2 : Motic B3 Light microscope


Picture taken from : http://spectraservices.com/Merchant2/merchant.mvc?Screen=PROD&Product_Code=B3S
  1. Hazards:


Broken glass may cause injuries to skin.
Hydrochloric Acid may cause irreversible eye injury.  Vapor or mist may cause
irritation and severe burns. Contact with liquid is corrosive and causes severe burns and ulceration to the skin.
Toluidine solution is an irritant and the solution stains .
Lab coat must be worn.    
Safety goggles must be used.

  1. Procedure:

    1. All apparatus needed were brought to the lab bench.
    2. Using a pipette, few drops of 1M HCL acid were placed in the glass block ,disposing of pipette after procedure in a safe place.
    3. Using the forceps, 6 root tips of about 2 mm long were detached from the plant material and placed in the acid. Time for reaction 3 minutes.
    4. Few drops of distilled water were placed in a watch glass.
    5. Using the tip of the forceps by picking up the material, the root tips were transferred to the watch glass containing distilled water.
    6. The hollow block containing acid was placed in a safe place after the transfer.
    7. Two of the root tips were transferred from the water on the microscope slide and using the absorbent paper the excess of liquid was dried up.
    8. One drop of the toluidine blue stain was added to the plant material.
    9. The cover slip was placed on the top of the material and gently taped on with the forceps. The tissue was well spread and blue.
    10. By gently lifting the cover slip up with the forceps and taping it down again, several times, the stain was covering up all the cells.
    11. The excess of the stain solution was dried up by using the absorbent paper.
    12. The microscope was connected to the electrical power and then switched on.
    13. The prepared slide was placed on the stage control of the microscope and secured with the clips.
    14. The lowest power objective (x4) was moved into place. (Diagram 1).

       
    15. The stage control was raised as high as it would go and then looking through the eye-piece the clear imagine was captured slowly by turning the stage up/down with the adjustment tools until the cells were clearly visible.
    16. By moving the stage sideways (to left and to right) using the stage tools the slide was explored and all the cells were explored.
    17. The details of the imagine were then recorded by drawing a diagram(Diagram 1).
    18. Objective lens was changed to (x10) and by very slow and gently refined movements(down) of the stage , the imagine was clear and the cells were observed in detail(Diagram 2).
    19. The field of view was recorded by drawing a diagram of the imagine.
    20. Objective lens was changed to (x100) and by very slow and gently refined movements(down) of the stage , the imagine was clear and the cells were observed(Diagram 3)..
    21. The field of view was recorded by drawing a diagram of the imagine
    22. The apparatus was cleared up and prepared slide was disposed off in the glass container.


Results


Proportion of cells undergoing Mitosis division in a given field of view (as seen in Diagram 2.):


Phase of mitosis Interphase Prophase Metaphase Anaphase Telophase 
No.of cells undergoing the process 66000


Diagram 1. Mitosis in root tips. Magnification 40


Diagram 2. Mitosis in root tips. Magnification 100


Diagram 3. Mitosis in root tips. Magnification 1000


Observations

One drop of toluidine solution was added to the material, which coloured the tissue from white colour to intensive blue.


Calculations

The magnification was calculated using the following formula:
MA = Mo x Me
Where MA is the angular magnification
Mo is the magnification of the objective lens and (x4; x10; x100)
Me is the magnification of the eyepiece lens.(has always same value x10)
MA = 4x10=40 MA = 10x10=100 MA =100x10=1000


Discussion


The purpose of this practical was to observe and identify under the light microscope the stages of mitosis division(interphase, prophase, metaphase, anaphase, telophase) by using meristemetic tissue from root tips.


The material was prepared and the slide was examined under the light microscope. Using the x4 objective lens it was observed that the cells were very well spread out thru the length of the slide so the reaction of the calcium pectate and hydrochloric acid was successful. The thin layer of cells was very clear and very well stained. The nuclei were all blue and the cytoplasm was clear. Using the x10 objective lens it was observed that the size of nuclei was different for each cell as diagram 2 shows above. Some of the nuclei were small and some cells had bigger nuclei. Analysing the intensity of the colour of nuclei, it has been observed that some were dark-coloured, (darker colour because of the matter being very tight condensed-doesn`t let a great amount of light to pass thru) and some of the nuclei were lighter coloured(presented less density of matter in the content).It has been noted that the small nuclei presented a dark blue colour( were very dense) while the bigger nuclei were light blue(more light was permitted thru, less density).
It has been observed that chromosomes are not clearly discerned in the smaller nucleus. The cell was in the interphase stage of mitosis.
It has been observed that the content of the bigger nucleus had less density. The cell was in the prophase stage of mitosis.


Section of Diagram 2Example of Interphase and Prophase
Photo taken from : University of Illinois http://www.life.illinois.edu/ib/102/lectures/08reproduction.html


Conclusion  


The purpose of this practical was to observe and identify under the light microscope the stages of mitosis division(interphase, prophase, metaphase, anaphase, telophase) by using meristemetic tissue from root tips.


The first 2 phases of mitosis, interphase and prophase, were observed in the cells of the root tips.
The experiment did not reveal any cells undergoing metaphase, anaphase or telophase stages of division. If time had allowed for it the experiment would have been more accurate if the search was carried out for all the material on the slide.


References


  • Baker, J.R. 1966: Cytological Technique (5th Ed.) Methuen: London.
Basic cell wall histochemistry
http://virtualplant.ru.ac.za/Main/FACTFILE/Histochem.htm


  • Fisher Scientific UK                                     
    
Material Safety Data Sheet  
https://extranet.fisher.co.uk/As400msds/msds?productCode=H/1000/PB17


  • National Institutes of Health. National Human Genome Research Institute. "Talking Glossary of Genetic Terms."
    Retrieved October 25, 2010, from http://www.genome.gov/glossary/
http://www.genome.gov/glossary/?id=130


  • School of Integrative Biology , University of Illinois
Integrative Biology 102: Lecture Outline
http://www.life.illinois.edu/ib/102/lectures/08reproduction.html


  • The Biology Project
Department of Biochemistry and Molecular Biophysics
University of Arizona
April 1997
Revised: October 2004 http://www.biology.arizona.edu
http://www.biology.arizona.edu/cell_bio/tutorials/cell_cycle/cells3.html


Biology Essay


MARK: 73
Student no:
Module : Principles of BiologyDate 19.11.2010


Essay Question:


Briefly explain the process of Protein Synthesis in terms of nucleic acids and, using a specific example, explain how a change in DNA may cause a new phenotypic characteristic?


The Process of Protein Synthesis


The DNA inherited by an organism leads to specific trait by dictating the synthesis of proteins. Proteins are the link between genotype and phenotype. The process by which DNA directs protein synthesis ( gene expression) includes two stages : transcription and translation.(Fig 1.) (Campbell, 2005)


Transcriptionis the synthesis of RNA under the direction of DNA. Both nucleic acids use the same language and the information is simply transcribed or copied form DNA molecule to RNA molecule. The base-pairing rules for DNA synthesis (AT CG GC TA) also guide transcription, but uracil (U) takes the place of thymine (T) in RNA. A gene does not build a protein directly, the bridge between DNA and the protein synthesis is the nucleic acid RNA. The RNA molecule which carries the genetic message from the DNA to the protein synthesizing system is called messenger RNA (mRNA) (Fig 1.) (Campbell, 2005)


Fig 1 . Transcription – Translation – Protein. Gene expression.
Source : Campbell and Reece , Biology 7th Edition 2005 pg 313.


Translation is the process of synthesis of polypeptide which occurs under the direction of mRNA.(Fig.1) (Campbell, 2005)
During this stage, there`s a change in language : the cell must translate the base sequence of an mRNA molecule into the amino acid sequence of a polypeptide. The sites of translation are ribosomes , complex particles that facilitate the orderly linking of amino acids into polypeptide chains.
The genetic code of mRNA is read by tRNA as triplets of nucleotides named codons.The codons (base triplets) in the mRNA are recognized by tRNAs which carry the appropriate amino acid to the translation machinery. (Fig.2)
Each tRNA is specific for one amino acid but many of the tRNAs can recognize more than one
codon. There are 61 possible codons and approximately 50 tRNAs in animal cells.
Three codons (UAG, UAA, and UGA) do not specify an amino acid-tRNA and
thus cause termination of translation. These codons signal the release of the polypeptide chain. The
ribosome then disengages from the mRNA and the subunits dissociate, ready to start the cycle
over again.


Fig.2 Translation of genetical information.
Source : Campbell and Reece , Biology 7th Edition 2005 pg 320.


In a cell lacking a nucleus, Prokaryotic cell , mRNA produced by transcription is immediately translated without additional processing .(Fig 3 .)


Fig 3 .Prokaryotic cell .
Source : Campbell and Reece , Biology 7th Edition 2005 pg.312

The nucleus of a eukaryotic cell provides a separate compartment for transcription. The original RNA transcript, called pre-mRNA, is processed in various ways before leaving the nucleus as mRNA.
(Fig . 4)


Fig4 . Eukaryotic cell.
Source : Campbell and Reece , Biology 7th Edition 2005 pg.312


Sickle Cell Anemia


The most common inherited disorder among people of African descendent is sickle-cell disease, which affects one out of 400 African-Americans. This disease was caused by modifications in DNA structure. The changes in the genetic material of a cell are called mutations. Spontaneous mutations are caused by errors during DNA replication, repair or recombination and can lead to base pair substitution , insertions or deletions. (Campbell, 2005)

Point mutations are chemical changes in just one base pair of a gene. The change of a single nucleotide in the DNA`s template strand leads to the production of an abnormal protein. Point mutations can affect protein structure and function and therefore observable physical and biochemical characteristics of an organism- changes in phenotype (Fig.6 and Fig.7).
Sickle cell disease is caused by a mutation of a single base pair in the gene that codes for one of the polypeptides of hemolgobin as shown in Fig. 5.


DNA normal

DNA mutant
Fig.5 Point mutation in DNA structure.


The diagram above shows the difference in the synthesis of hemoglobin from normal DNA and from mutant DNA.
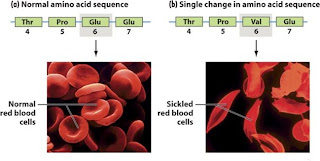
A single substitution (T with A), point mutation, has changed the base sequence in the DNA. The base sequence on the mRNA produced in transcription from the mutant template strand of DNA is different from the structure of normal mRNA. As a result a codon on the mutant mRNA is altered. A different amino acid is inserted into the protein chain. The amino acid valine is inserted instead of glutamic acid. The protein synthesised is altered and no longer functions normally. These sequences result in sickle-shaped red blood cells. This blood disorder is known as sickle cell anaemia.

Fig.6 Comparison of physical shape of normal hemoglobine a sickle-cell disease hemoglobine.
Source :http://www.ncbi.nlm.nih.gov/bookshelf/br.fcgi?book=iga&part=A1622#A1638


The change of just one amino acid is sometimes enough to alter protein function. This was first shown in 1957 by Vernon Ingram, who studied the globular protein haemolgobin.
Ingram compared hemoglobin A (HbA), the hemoglobin from normal adults, with hemoglobin S (HbS), the protein from people homozygous for the mutant
gene that causes sickle-cell anemia. Ingram found that the fingerprint of HbS differs from that of HbA in only one spot. Sequencing that spot from the two kinds of hemoglobin, Ingram found that only one amino acid in the fragment differs in the two kinds. Apparently, of all the amino acids known to make up a hemoglobin molecule, a substitution of valine for glutamic acid at just one point, position 6 in the β chain, is all that is needed to produce the defective hemoglobin (Fig. 7). Unless patients with HbS receive medical attention, this single error in one amino acid in one protein will hasten their death.


Protein architecture is the key to gene function, the substitution of a amino acid into the polypeptide sequence of a protein leads to new chemical properties that are incompatible with the proper protein architecture at that particular position; in such a case, the mutation will lead to a non-functional protein as shown in fig 7 and 10.


Fig. 7 Comparison of structure and function between normal and sickle-cell hemoglobin.
Source : Campbell and Reece , Biology 7th Edition 2005 pg.84


Fig. 8 Normal hemoglobin
Source: http://www.medicineamigo.com/

Fig.9 Comparison of physical shape.
Source: http://www.bertmiddletonhealth.com/

Normal red blood cells are disc-shaped and move easily through blood vessels.Sickle cells contain abnormal hemoglobin that causes the cells to have a sickle, or crescent, shape. These cells don't move easily through blood vessels. They're stiff and sticky and tend to form clumps and get stuck in the blood vessels. The clumps of sickle cells block blood flow in the blood vessels in the limbs and organs. Blocked blood vessels can cause pain, serious infections, and organ damage.


Fig. 10 Blood flow in a small blood vessel .Comparison between normal and sickle-cells of haemolgobin.
Source: http://www.nhlbi.nih.gov/health/dci/Diseases/Sca/SCA_WhatIs.html


Figure A shows normal red blood cells flowing freely in a blood vessel. The inset image shows a cross-section of a normal red blood cell with normal hemoglobin.
Figure B shows abnormal, sickled red blood cells clumping and blocking blood flow in a blood vessel The inset image shows a cross-section of a sickle cell with abnormal hemoglobin forming abnormal strands.
Red blood cells are made in the spongy marrow inside the large bones of the body. Bone marrow is always making new red blood cells to replace old ones. Normal red blood cells live about 120 days in the bloodstream and then die. In sickle cell anemia, the number of red blood cells is low because sickle cells don't last very long. Sickle cells usually die after only about 10 to 20 days. The bone marrow can't make new red blood cells fast enough to replace the dying ones.
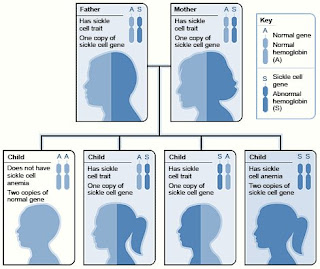
Sickle cell anemia is an inherited, lifelong disease. People who have the disease are born with it. They inherit two copies of the sickle cell gene—one from each parent.
People who inherit a sickle cell gene from one parent and a normal gene from the other parent have a condition called sickle cell trait.
People who have sickle cell trait don't have the disease, but they have one of the genes that cause it. Like people who have sickle cell anemia, people who have sickle cell trait can pass the sickle cell gene on to their children.
Two copies of the sickle cell gene are needed for the body to make the abnormal hemoglobin found in sickle cell anemia.


Fig.11 Example of an Inheritance Pattern for Sickle Cell Trait

Source: http://www.nhlbi.nih.gov/health/dci/Diseases/Sca/SCA_WhatIs.html


The image shows how sickle cell genes are inherited. A person inherits two copies of the hemoglobin gene—one from each parent. A normal gene will make normal hemoglobin (A). An abnormal (sickle cell) gene will make abnormal hemoglobin (S).

In individuals who are homozygous for the mutant allele, the sickling of red blood cells caused by the altered hemoglobin produces the multiple symptoms associated with sickle-cell disease (Fig 12 ).


Figure 12 The compounded consequences of one amino acid substitution in hemoglobin to produce sickle-cell anemia.
Source: http://www.ncbi.nlm.nih.gov/bookshelf/br.fcgi?book=iga&part=A1622#A1638


Resources


  • Campbell et al, Biology, 2005, 7th edition, Pearson Education, Inc., Benjamin Cummings, San Francisco. ISBN: 0-321-26984-5


  • http://www.bbc.co.uk/scotland/learning/bitesize/higher/biology/genetics_adaptation/mutations_rev1.shtml (visited on 8 nov 2010)
  • http://bertmiddletonhealth.com/health-concerns/sickle-cell/ (visited on 9 nov 2010)


  • http://www.medicineamigo.com/disease/Famous-People-With-Blood-Diseases.html
  • http://www.nhlbi.nih.gov/health/dci/Diseases/Sca/SCA_WhatIs.html (visited on 8 nov 2010)


  • http://www.ncbi.nlm.nih.gov/mapview/maps.cgi?ORG=hum&CHR=11&MAPS=ideogr%5B11pter%3A11qter%5D,loc%5B0.000000%3A142127415.000000%5D&query=e:HBB (visited on 10 nov 2010)